Which age group in the U.S. has the greatest amount of income inequality among its members? The choices are:
- Age 15-24
- Age 25-34
- Age 35-44
- Age 45-54
- Age 55-64
- Age 65-74
- Age 75 and older
We won't keep you in suspense - the chart below reveals the answer!
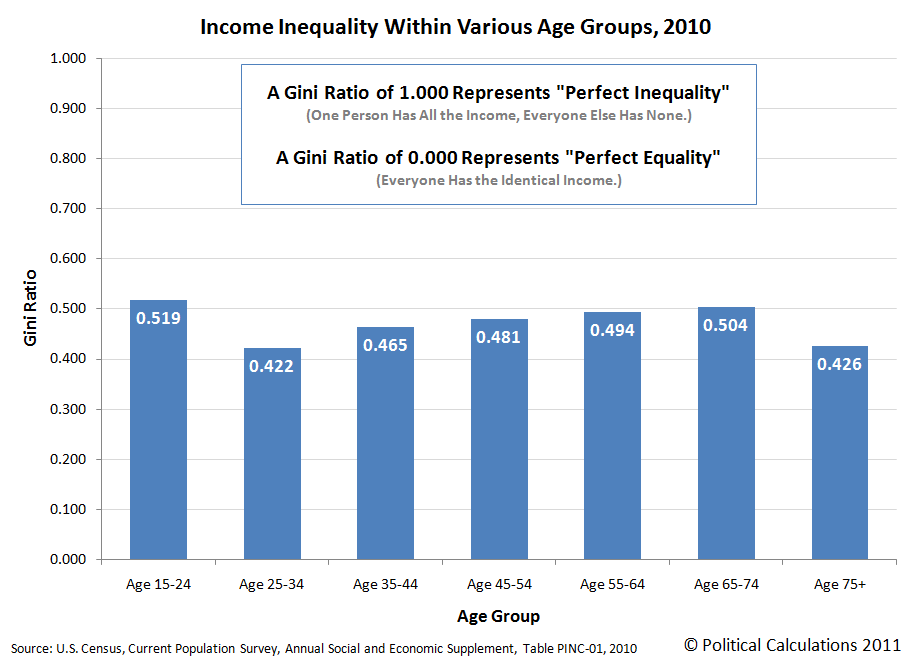
Are you surprised to see that teens and young adults between that ages of 15 and 24 have the greatest amount of income inequality, as measured by the Gini Coefficient?
If it helps understand why, consider that this age group really represents the point at which Americans enter into their first jobs. It covers everyone from those who haven't graduated from high school, but are working in part-time, minimum wage level jobs on up through recent college graduates in difficult, high paying disciplines like petroleum engineering.
Meanwhile, we see that the level of income inequality drops dramatically for adults between the ages of 25 and 34, which corresponds to individuals who have fully entered into their careers. The amount of income inequality by age group then increases through Age 65-74.

To a large extent, what you're seeing here is the effect of education level upon the lifetime earnings of individuals, where those with higher levels of education tend to have greater income growth over time.
But that doesn't explain it all. Most individuals hit their peak earning years in their mid-to-late 40s, which wouldn't explain why income inequality continues to increase for older individuals.
Here, we need to consider the role of investment income. Assuming that the most successful income earners also consistently save or invest a portion of their income over time, if they realize positive rates of return, they can continue boosting their income above and beyond what they earn through wages and salaries.
That's a big reason why we see that individuals Age 65-74 have the second greatest amount of income inequality by age group - the most successful individuals are benefiting from a lifetime of saving and investing, while others within this age group earn much lower amounts of income, or none, through investing.
We next see that income inequality falls dramatically from Age 65-74 to Age 75 and older. This drop largely corresponds to the depletion of retirement savings that individuals set aside during their working years, which reduces the amount of income they might receive from the reduced principal they have invested.
Meanwhile, for this age group, individuals who were less successful in establishing retirement savings benefit from government income transfer programs like Social Security, which provides disproportionately large benefits to the people who earned the lowest incomes during their working years.
We'll close by sharing Payscale.com's chart showing the typical incomes earned by individuals just graduating college with degrees in the top-paying fields of 2011:
 |  Methodology Annual pay for Bachelors graduates without higher degrees. Typical starting graduates have 2 years of experience; mid-career have 15 years. See full methodology for more. |
Data Source
U.S. Census. Current Population Survey. Annual Social and Economic Supplement. Table PINC-01. Selected Characteristics of People 15 Years Old and Over by Total Money Income in 2010, Work Experience in 2010, Race, Hispanic Origin and Sex. Accessed 13 November 2011.
Labels: income inequality
Welcome to the blogosphere's toolchest! Here, unlike other blogs dedicated to analyzing current events, we create easy-to-use, simple tools to do the math related to them so you can get in on the action too! If you would like to learn more about these tools, or if you would like to contribute ideas to develop for this blog, please e-mail us at:
ironman at politicalcalculations
Thanks in advance!
Closing values for previous trading day.
This site is primarily powered by:
CSS Validation

RSS Site Feed
JavaScript
The tools on this site are built using JavaScript. If you would like to learn more, one of the best free resources on the web is available at W3Schools.com.
Other Cool Resources
Blog Roll


