Previously on Political Calculations, we discovered that we can use international trade data to diagnose the relative health of national economies.

The way this works is to consider that a growing economy will demand more goods - a portion of which will be imported from outside the country. By measuring the growth rate of both imports and exports between two nations, we can determine how relatively "healthy" the economies of both nations are.
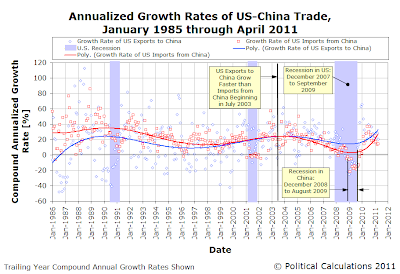
Our favorite two nations to look at are the U.S. and China. When we looked at the international trade through May 2010 between these two nations, we found that both the U.S. and China had growing economies following recessions and that China's economy seemed to be driving the U.S. economy.
Today, nearly a year later, we find that both nations would appear to have growing economies, but that after the Chinese economy surge in the last quarter of 2009, and the U.S. economy surging in the first half of 2010, both the U.S. and Chinese economies are growing much more slowly.

A special concern now is that the rate of growth of U.S. imports from China is slowing, which indicates that economic growth in the U.S. is comparatively weaker than it is in China.
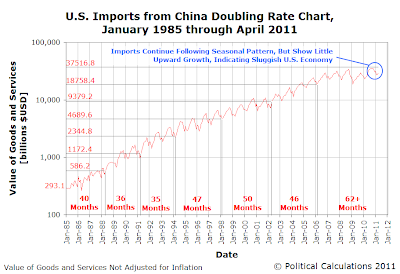
We confirm that outlook in examining our doubling rate chart showing the level of U.S. imports from China from January 1985 through April 2011.
Here, we see that it has been more than five years since the U.S. doubled the amount that it imports from China, which is significantly more than the 3 to 4 years that these imports doubled in the twenty years from 1985 through 2005.

By contrast, see that the value of U.S. exports to China has almost doubled since January 2009, which is putting the period since that time on a pace to potentially beat the shortest doubling time recorded for the value of U.S. exports to China of 32 months, which was set between January 2001 and July 2003.
We suspect that this extremely rapid rate of growth for U.S. exports to China is being largely driven by the China's massive economic bubble, so we would anticipate that U.S. exports may drop considerably once that bubble enters into its deflation phase.
Which like all economic bubbles, will happen. It's only a matter of when and how.
Labels: trade
Welcome to the blogosphere's toolchest! Here, unlike other blogs dedicated to analyzing current events, we create easy-to-use, simple tools to do the math related to them so you can get in on the action too! If you would like to learn more about these tools, or if you would like to contribute ideas to develop for this blog, please e-mail us at:
ironman at politicalcalculations
Thanks in advance!
Closing values for previous trading day.
This site is primarily powered by:
CSS Validation
RSS Site Feed
JavaScript
The tools on this site are built using JavaScript. If you would like to learn more, one of the best free resources on the web is available at W3Schools.com.