 Now that the U.S. Bureau of Economic Analysis has finalized its GDP data for the fourth quarter of 2009, we can now officially project where the nation's inflation-adjusted GDP will be for the first quarter of 2010.
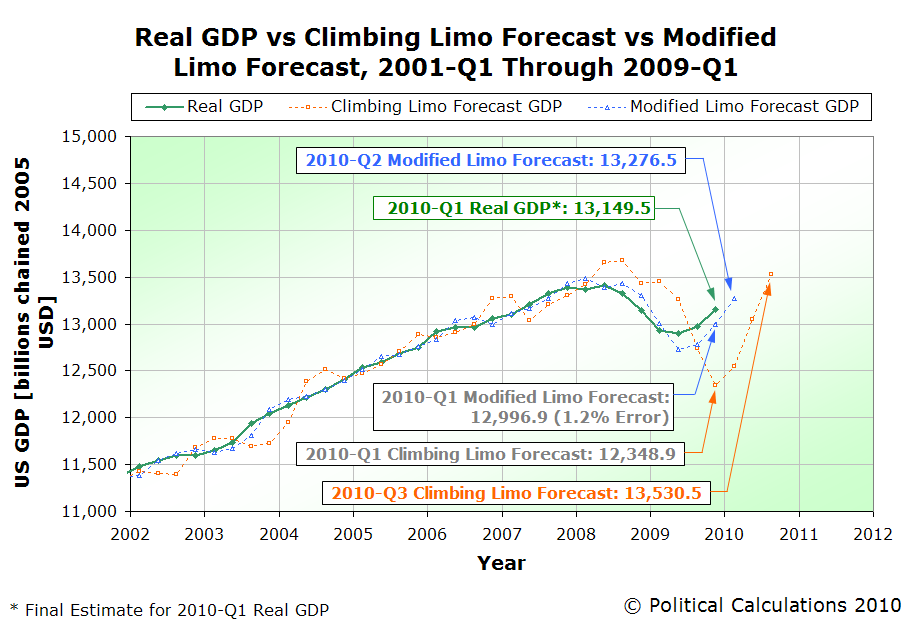
Using our Modified Limo method of forecasting real GDP, we anticipate that the United States' inflation-adjusted GDP for 2010-Q1 will be within 2.0% of $13,276.5 billion, as expressed in terms of constant 2005 U.S. dollars.
That marks an increase from the BEA's recorded final estimate for GDP in 2009-Q4 of $13,149.5 billion 2005 chained U.S. dollars. The low end for our forecast range corresponds to a real GDP of $13,011 billion, while the upper end corresponds to a real GDP of $13,542 billion.
If you'd like us to narrow that range down, we find a nearly 70% chance of real GDP falling into a range between $13,136 and $13,417 billion chained 2005 U.S. dollars in the first quarter of 2010.
Going back to our projection of where the U.S. inflation-adjusted GDP would be finalized for the fourth quarter of 2009, we came within 1.2% of the final figure of $13,149.5 billion chained 2005 U.S. dollars. We had anticipated that the final GDP figure for 2009-Q4 would be $12,996.9 billion in our earlier projection based upon the finalized value for real GDP in 2009-Q3.
Labels: gdp forecast
 Our colleagues at NASA recently made news for a record achievement, although not in a good public relations way for the government space agency:
The nation's space agency paid the out-of-this-world price of $66 a person a day for bagels, cookies and juice at a conference, a new report found.
The subject of the NASA conference? It was a training session for its procurement officials - the people who do the buying with taxpayer funds.
During the three-day conference, the 317 attendees snacked on "light refreshments" of soda, coffee, fruit, bagels and cookies at a cost of $62,611, according to a NASA Inspector General report. That's $66 a day per person.
Fortunately, NASA is on top of it!
When asked why NASA spends so much on snacks, a NASA spokesman referred to the agency's response in the report, which didn't explain the costs but promised to do better. In that response, NASA deputy chief financial officer Terry Bowie defended the practice of buying snacks at conferences, saying it would keep attendees from wandering away. But Bowie said next month NASA will define "reasonable cost limits" for snacks at conferences.
And what's reasonable?
That happened to be the topic of a session at the Baltimore conference - how to determine a reasonable price.
The government is in the very best of hands!
Image Credit: Super Sized Meals.com, which indicates that producing Bruegger's world-record holding bagel required 660 pounds of flour, 348 pounds of water, one-half pound of yeast, 53 pounds of malt and 12.5 pounds of salt. The giant bagel, nearly four thousand times larger than a "normal" Bruegger's bagel, was boiled for 30 minutes before being baked for nearly ten hours. The final product weighed 868 pounds, measuring some six feet in diameter, with a thickness of 20 inches.
Labels: none really
 There are two groups of people to whom one should never ask the question posed in our post title today: vegetarians and environmentalists, mainly due to the consequences that will be unleashed by the moral superiority tsunami you're almost sure to experience if you provide either group of people with that kind of opening. (Just follow the links to each for examples of what you can reasonably expect....)
Instead, asking whether or not one should turn to vegetarianism to save the earth is best asked of just about anyone else. And as it happens, someone just did that, asking the question of Tim Harford through his "Dear Economist" column:
Dear Economist,
A growing trend among my fellow students is converting to vegetarianism for environmental reasons, citing statistics that meat production, in particular beef, is a tremendous cause of greenhouse gas emissions. I was wondering if you could provide some insight into the actual environmental cost of a steak. How does it compare to driving, or flying? Would a simple tax on beef production be much more efficient than vegetarianism?
Max
Dear Max,
Your friends are right to worry about beef; you are right to ask questions. Let’s start with the beef itself. Cows are ruminants, which means they produce large quantities of methane – contrary to what some people believe, much of this is emitted through the mouth. Methane is a powerful but transient greenhouse gas, so it is not straightforward to compare with carbon dioxide emissions, especially those produced by planes at altitude, which are more damaging.
Using a standard rule of thumb – and the work of “Economical Environmentalist“ Prashant Vaze – I can inform you that a 250g steak is responsible for more than 4kg of CO2-equivalent emissions, before cooking the stuff.
Sheep is just as bad; pork and chicken are half as bad; cod or wheat are at least eight times less carbon-intensive; potatoes and herring are far better still. Organic methods reduce carbon dioxide emissions, but not by much.
Yet this all looks modest relative to the costs of transport. Vaze reckons that steak’s emissions will get you about eight miles by plane, or 15 miles if you travel alone in a car.
As for the tax, it should be on all greenhouse gases, not just cow burps. I suspect it would create a few vegetarians, perhaps better diets for cows, and headaches for the taxman. More importantly, it would inspire some loft insulation.
 And now we'll add our two cents to the discussion. Now, this is not exactly new territory for us, in that we previously examined the environmental impact of buying local produce compared to having it shipped to your local supermarket from halfway around the world. But one thing we didn't do in that previous analysis was to consider how much carbon-based fuel and materials go into producing the Earth's transportation systems - we had only looked at how much fuel would be consumed in the actual transportation.
That's important because it turns out that many of the analyses done to compare the greenhouse-gas emissions figures for meat production with those used in transportation completely leave out that aspect, which is something that air quality expert Frank Mitloehner recently pointed out in a presentation to the 239th National Meeting of the American Chemical Society:
Mitloehner says confusion over meat and milk's role in climate change stems from a small section printed in the executive summary of a 2006 United Nations report, "Livestock's Long Shadow." It read: "The livestock sector is a major player, responsible for 18 percent of greenhouse gas emissions measured in CO2e (carbon dioxide equivalents). This is a higher share than transport."
Mitloehner says there is no doubt that livestock are major producers of methane, one of the greenhouse gases. But he faults the methodology of "Livestock's Long Shadow," contending that numbers for the livestock sector were calculated differently from transportation. In the report, the livestock emissions included gases produced by growing animal feed; animals' digestive emissions; and processing meat and milk into foods. But the transportation analysis factored in only emissions from fossil fuels burned while driving and not all other transport lifecycle related factors.
"This lopsided analysis is a classical apples-and-oranges analogy that truly confused the issue," he said.
How big are those transport lifecycle factors with respect to the environmental impact of livestock as measured by their greenhouse gas emissions? Mitloehner provides the apples-to-apples comparison for the United States:
Transportation creates an estimated 26 percent of all greenhouse gas emissions in the U.S., whereas raising cattle and pigs for food accounts for about 3 percent, he said.
Mitloehner also observes the likely unintended consequences of reducing meat and dairy production, while identifying where the world's focus on addressing the issues should be:
"We certainly can reduce our greenhouse-gas production, but not by consuming less meat and milk," said Mitloehner, who is with the University of California-Davis. "Producing less meat and milk will only mean more hunger in poor countries."
The focus of confronting climate change, he said, should be on smarter farming, not less farming. "The developed world should focus on increasing efficient meat production in developing countries where growing populations need more nutritious food. In developing countries, we should adopt more efficient, Western-style farming practices to make more food with less greenhouse gas production," Mitloehner said.
We'll close by pointing to The Armchair Economist Steven Landsburg's timeless explanation of why he isn't an environmentalist, which reaffirms nearly all the points we've made in this post!
Labels: environment
 Welcome to the Friday, March 26, 2010 edition of On the Moneyed Midways, where each week, we scan the money, personal finance, and business blog carnival's to bring you the best of what we find!
Soon, we'll be hosting the Cavalcade of Risk. We do have something new and unique planned for the carnival, but we should warn all contributors now that we will be using our well-established Cavalcade of Risk rating system. If there are those among you who dare anger the host, you'll find out that there is indeed a risk to contributing anything less than a well-written, on-topic post to the Cavalcade.
And now, you can't say that you weren't warned!...
Meanwhile, the best posts we found in the best of the past week's money and business-related blog carnivals await your review below....
| On the Moneyed Midways for March 26, 2010 | |||
|---|---|---|---|
| Carnival | Post | Blog | Comments |
| Carnival of Debt Reduction | Should I Make My House Payment or Pay My Credit Card Bill? | Credit Card Assist | It's not a question we've ever considered, but given the situation with so many home values being so far underwater compared to the valuations recorded in the homeowners' mortgages, perhaps Credit Card Assist's discussion of the topic was inevitable. |
| Carnival of HR | Carnival of HR | HR University | We're not fans of themed blog carnivals, but Joan Ginsberg's edition of the Carnival of HR has a unique hook: she profiles a number of fellow blogging HR professionals who, like her, are unemployed and actively seeking work. |
| Carnival of Personal Finance | What NOT to Do After Filing for Bankruptcy | Budgets Are Sexy | J. Money understands that the process for filing bankruptcy can carry a lot of emotional stress, but the absolute last thing he expects is for the recent bankruptee to celebrate with a fancy dinner and new designer clothes!... |
| Carnival of Personal Finance | What NOT to Do After Filing for Bankruptcy | Budgets Are Sexy | Absolutely essential reading! J. Money understands that the process for filing bankruptcy can carry a lot of emotional stress, but the absolute last thing he expects is for the recent bankruptee to celebrate with a fancy dinner and new designer clothes!... |
| Cavalcade of Risk | Poachers Turned Gamekeepers | The Epicurean Dealmaker | The Best Post of the Week, Anywhere! TED unloads on what's wrong with the regulators of banks and financial organizations with respect to the systemic risks they tolerate and offers his plan for replacing the spineless overseers of recent years with people who have not just backbones, but a bone to pick!... |
| Festival of Frugality | My Rant Against Tipping | Financial Uproar | Is tipping really nothing more than a system of blackmail instituted by waiters? Financialuproar delivers on his name's promise in serving up Absolutely essential reading! |
| Carnival of Money Stories | My Inner Imelda Marcos | Bucksome Boomer's Journey to Retirement | Bucksome likes shoes. A lot. Actually, more than a lot. Here, she reveals how Mr. Boomer's shoe intervention has kept both her closet organized and her shoe budget under control. |
OMM's Running Index for 2010
Presented in reverse chronological order....
- On the Moneyed Midways - March 26, 2010
- On the Moneyed Midways - March 19, 2010
- On the Moneyed Midways - March 12, 2010
- On the Moneyed Midways - March 5, 2010
- On the Moneyed Midways - February 26, 2010
- On the Moneyed Midways - February 19, 2010
- On the Moneyed Midways - February 13, 2010
- On the Moneyed Midways - February 5, 2010
- On the Moneyed Midways - January 29, 2010
- On the Moneyed Midways - January 23, 2010
- On the Moneyed Midways - January 15, 2010
Older Editions
- OMM: The Best Posts of 2009 and our full index for the year!
- OMM's Running Index for 2008
- OMM's Running Index for 2007
- The Best Blogs Found in 2006 (and our full 2006 index)!
Labels: carnival
 There's a lot of speculation that China is currently undergoing a housing bubble. Since we recently developed the analytical tools needed to conclusively make that kind of determination for a nation, we applied them to look at China's situation. What those tools suggest is that China's housing market is actually responding directly to larger economic forces at work in its economy, and as a result, we find that China both does, and does not, have a housing bubble.
Here's what we mean by that. By our definition, a bubble may be said to exist whenever the price of an asset that may be freely exchanged in a well-established market first soars, then plummets over a sustained period of time at rates that are decoupled from the rate of growth of the income that might be realized from owning or holding the asset. So, for an asset like a house, we would say a bubble exists if, over a period of time, we saw its price first sharply rise, then fall with respect to the income that might be earned from simply renting the house.
By contrast, if order exists in a housing market, we will see a close coupling between the values of housing prices and rents over time.
What we recently discovered is that we can substitute income for rent in assessing whether a bubble has formed in a housing market. Since income data is much easier to find for nations than rent data, we've been able to apply our new analysis technique to the recent history for the housing markets of the United States, England, Canada and Australia.
As it happens, it is extremely easy to determine if something is amiss in a nation's housing markets. When order exists, we find that housing prices follow a consistent straight line trajectory with respect to income over time. We can then easily determine when something has happened to affect housing prices by observing when housing prices deviate from their normal linear trajectory.
 Here is what we observe when we look at China's housing market, when we chart our estimate of average Chinese house prices against average disposable income. The average disposable income data is taken from the Shanghai Statistical Year Book, while we estimated the average value of house prices in China by multiplying the ratio of average house prices to income in China given by the Economist.
We see that a very close coupling between housing prices and disposable income existed at least from 1999 through 2003. However, in 2003, we observe a large deviation from that established trend as housing prices began following a new linear trajectory, which continued through 2007.
What that observation tells us is that something happened, most likely in late 2003, to set housing prices on a higher growth rate trajectory with respect to the growth of income. Since that new trajectory is linear, we find that housing prices were driven upward by a change in overall economic conditions, which suggests that China's housing market was not in a bubble.
That observation is contradicted by what we see next. In 2008, housing prices plunged while average disposable incomes were barely changed. This outcome suggests that a bubble existed in the Chinese housing market from 2003 through 2008.
Finally, in 2009, we see both housing prices and disposable incomes surging upward, as the Chinese economy responded to its government's massive stimulus programs initiated in reaction to the worldwide economic crisis of 2008.
What we would hypothesize from these observations is that whatever bubble exists in China extends far beyond the nation's housing market, which has actually responded rationally to those conditions. We would then conclude is that what China has really been dealing with is an economic bubble that extends across many sectors of its economy. We also find that the rapid resurgence of housing prices in 2009 suggests that China may now have formed a true housing bubble in addition to its overall economic bubble.
Like all economic bubbles, they will end. It's just a matter of when and how.
Labels: economics, real estate
 We think there's something seriously wrong with the people who make movies in Hollywood. Specifically, the people who keep spending millions and millions of dollars to make box office flops in pursuit of making the definitive modern anti-Iraq war/War on Terror movie.
Fortunately, that's all over with now that The Hurt Locker has definitively been crowned as the best modern anti-Iraq war/War on Terror movie ever made, thanks to its winning of the Academy Award for Best Picture of 2009. Finally, Hollywood's power elite can turn its collective attention back to making big screen versions of old television shows!
And just as definitively, The Hurt Locker turned out to be a complete flop at the U.S. box office, having accumulated an estimated $16.4 million in receipts throughout its 147 days in the theaters, spanning 26 June 2009 through 19 November 2009. With a production cost of $15 million though, at least it wasn't a complete bust on that level, although Hollywood's notorious accounting will say otherwise....
Still, what brings all this up is the performance of Green Zone at the box office during its opening weekend. Here, according to Reuters, the movie collected $14.5 million in just its first three days, which was a major disappointment:
"Green Zone" opened at a distant No. 2 in North America with $14.5 million. Distributor Universal Pictures, which axed its top executives last fall after a poor run at the box office, had hoped for a slightly better showing.
"It's a bit of a disappointment," said Nikki Rocco, president of distribution at the General Electric Co unit.
Damon plays a U.S. soldier questioning the supposed existence of weapons of mass destruction shortly after the U.S.-led invasion of Iraq. Reviews were mixed.
The $100 million movie was directed by British filmmaker Paul Greengrass, who collaborated with Damon on the second two movies in the "Bourne" action trilogy. Those opened to $52.5 million and $69 million, respectively.
Rocco noted "Green Zone" did better than most other entries in the Iraq war genre, including Oscar best picture winner "The Hurt Locker," which has earned about $16 million since June.
That made us wonder. Is Rocco right? Should she be trumpeting the relative performance of Green Zone with respect to the other members of the anti-Iraq war/War on Terror film genre?
We decided to find out. We went back and got the box office data for both The Kingdom and Rendition, 2007's most noteworthy efforts in that acclaimed film genre, with The Kingdom being the top grossing major release in the genre and Rendition as the previous title holder for the lowest. Let's look first at how these two films performed back in 2007, when they went virtually head-to-head against each other in the fall of that year.
 Comparing the daily gross per theater of both The Kingdom and Rendition from Box Office Mojo, we find that Rendition's financial performance was truly awful. Released three full weeks after The Kingdom, as the number of theaters showing that film dropped to 1,730 from its peak of 2,836 theaters in the previous week, Rendition barely had a higher total box office take per theater, despite being brand new and showing in 2,250 theaters, some 520 more than The Kingdom. Small wonder then that Rendition got pulled from theaters after just 21 days.
Next, to compare these movies with Green Zone, we adjusted the daily gross per theater data for each to be expressed in terms of 2010 U.S. dollars.
 Our next chart then compares each film's daily inflation-adjusted gross per theater for each day of its release, which allows us to do a direct side-by-side comparison of their box office performance. By this measure, we see that Green Zone falls between both The Kingdom and Rendition, at least through its first ten days of release. We also see that Green Zone would appear to be holding its relative position with respect to the daily gross per theater by day of release generated by its 2007 peers in the film genre, even as it is being shown in over 3000 theaters, which perhaps accounts for its larger overall gross.
This observation suggests that Nikki Rocco is right, although that's certainly not much to brag about in the low revenue generating genre of anti-Iraq war/War on Terror films.
It occurs to us though that daily gross per theater isn't what defines a Tinseltown bomb. Instead, what decides if a major motion picture is a flop is how much it makes at the box office with respect to how much it cost to produce.
What we did next then was to look at each movie's total take from the ticket window during its opening weekend, which would be the point at which movie studio managers would be making key decisions about how long they would really keep each movie in the theaters, converting this figure into constant 2010 U.S. dollars. Since we observe that each of the films maintains a relatively steady position with respect to each other for each day of release, this approach of just looking at the relative success of each based on its opening weekend performance should be sufficient to evaluate the financial performance of each with respect to each other.
We then divided the inflation-adjusted opening weekend gross for each movie by its cost of production, converting the results into a percentage value. Our following chart illustrates what we found.
 We see that The Kingdom made back 23.4% of its production cost in its opening weekend, confirming its place as the top grossing film in the anti-Iraq war/War on Terror film genre. Things get more interesting though when we compare Rendition with Green Zone.
Here, we see that Rendition actually outperformed Green Zone at the box office! Rendition made back 14.8% of its production cost in its first weekend, while Green Zone only collected 14.3% of its production cost in its opening three-day weekend.
It would seem then that Green Zone is a bigger box office bomb than Rendition. Worse, unlike The Hurt Locker, it's unlikely that Green Zone will remain in theaters long enough to recoup its production costs and make money. We would estimate its total life expectancy at the box office to be somewhere around 5-6 weeks. Nikki Rocco is wrong!
Labels: academy awards, box office, business, movies
Harvard economist Greg Mankiw, a huge fan of Pigouvian taxes, once famously proposed using them to deal with a fundamental issue of income inequality: human height disparity. He describes the issue in his paper with Matthew Weinzierl:
Should the income tax system include a tax credit for short taxpayers and a tax surcharge for tall ones? This paper shows that the standard utilitarian framework for tax policy analysis answers this question in the affirmative. This result has two possible interpretations. One interpretation is that individual attributes correlated with wages, such as height, should be considered more widely for determining tax liabilities. Alternatively, if policies such as a tax on height are rejected, then the standard utilitarian framework must in some way fail to capture our intuitive notions of distributive justice.
Fortunately for both the tall rich and the economically disadvantaged short, German artist Hans Hemmert has devised a technological solution that will allow people to overcome the bias and discrimination that provides the tall with an additional $1,000 per year in wages for every inch they lord over the short. Via Core77:

Berlin-based artist Hans Hemmert (famous for his work with balloons) threw a party where guests wore shoe-extenders to make them all the same height of 2 meters. Aside from bringing the partygoers all to a common eye level (and eliminating the awkward postures of party talk between the tall and the short), the gathering is lent an infographic nature by the shoes: all made from blue foam, the person's real height is read in the visual uniformity of the sole instead of at the head—like a walking bar graph.

Finally, an effective, yet inexpensive solution for the social problems of height disparity, which serves the dual purpose of also establishing visual uniformity at the grassroots level. What could be more equal? And best of all, the dream of the NAASP can be achieved in our lifetimes....
Labels: income inequality, satire
 Applying our technique of using the growth of international trade to diagnose the relative economic health of nations, we find that the Chinese economy has strongly rebounded from the economic recession that began for it back in either November or December 2008. We also find it likely that the U.S. has exited its recession, which began in December 2007, at approximately the same time in the third quarter of 2009.
We see the evidence supporting these conclusions in our chart of the trailing year-over-year growth rate of each nation's exports to each other. Comparing each nation's economic recoveries with each others, we find that China's economy is growing much more strongly than the U.S. economy, which is reflected by the soaring year-over-year growth rate of U.S. exports to China following the bottoming of the Chinese recession in approximately August 2009.
What's more, in comparing the average growth rates over time, we see that the margin in favor of the growth rate in the export of U.S. goods and services to China has opened to its widest margin ever with respect to the growth rate of Chinese goods and services to the United States.

U.S. imports from China are following a seasonal pattern, but are showing little growth, which suggests that the post-recession recovery in the U.S. is fairly sluggish.
We confirm these observations in our doubling rate charts showing the level of exports of each nation to the other.
Curiously then, in the face of such conditions already strongly favoring the fortunes of U.S. exporters, the Obama administration has focused its trade diplomacy upon the relationship between the Chinese renminbi and the U.S. dollar, pushing the Chinese government to act to reduce the relative value of the dollar with respect to the Chinese currency by increasing the value of the renminbi.
The policy would seem designed to boost the sluggish economic growth of the United States at the expense of the strongly growing Chinese economy, which is already boosting U.S. exporters without any such intervention thanks to its strong growth. It also suggests that the Obama administration does not have confidence that its economic policies can achieve higher rates of economic growth in the U.S. organically.

Meanwhile, looking at U.S. exports to China, we see a huge spike in Chinese demand for U.S. goods and services, which indicates very strong demand following China's recession, benefiting U.S. exporters.
One wonders when the apparent lack of confidence by the Obama administration in its economic policies might instead be converted into a realization that the administration's economic policies may be their real problem....
Previously on Political Calculations
- US-China Trade: The Last Three Years, Gone
- China in Recession
- Using International Trade Growth to Diagnose the Economy
- Will China's Economy Burst?
- Why Does Everything Cost So Much More Today?
Labels: trade
Welcome to the Friday, March 19, 2010 edition of On the Moneyed Midways, where each week, we present the best posts we found in the best of the previous weeks' money and business-related blog carnivals!
We're playing a little bit of catch-up today, as we somehow missed the "Best of Money" carnival from last week. As a result, we're feature posts from both it and the newest edition of the "Best of Money" carnival in this edition of OMM.
Those posts, and the rest of the best posts we found in the week that was, await you below!...
| On the Moneyed Midways for March 19, 2010 | |||
|---|---|---|---|
| Carnival | Post | Blog | Comments |
| Carnival of Debt Reduction | Thought Provoking Quotes About Debt and Paying Interest | Steadfast Finances | Matt uses a variety of quotes, proverbs and sayings as a springboard for his own commentary on different aspects of debt. |
| Carnival of HR | Achieving High Performance with Leader Athletes | i4CP TrendWatcher | Mark Vickers finds a model in the agility required for athletic excellence to apply toward leadership in business organizations. Absolutely essential reading! |
| Carnival of Personal Finance | Life Style Inflation: Why Your Savings Is Not Growing As Fast As Your Income | Personal Finance Ninja | Mike looks at how bigger incomes often translate into bigger spending, then shows how to draw the line at "enough!" Absolutely essential reading! |
| Carnival of Taxes | 6 Reasons You Won't Go to Finance Hell If You're Getting a Tax Refund This Year | Darwin's Finance | If you listen to many consumer advocates, they'll tell you that it's a mistake to withhold too much income from your taxes. Darwin lists six reasons for how having too much taken out of each of your paychecks by the government may work in your favor. |
| Festival of Frugality | The $25 Food Project Finale: Recipes, Conclusions, and an Exit Interview | Cheap, Healthy, Good | Kristen Swensson took on the challenge of feeding her six-foot, 205 pound fiancee with just $25 worth of food for a week. How she managed to do it while leaving him full at the end of each day is The Best Post of the Week, Anywhere! |
| Carnival of Money Stories | Making Impressions at the Grocery Store | Buck$ome Boomer's Journey to Retirement | Bucksome saved $96.00 on her weekly grocery bill, causing the person behind her in line at the checkout to gasp. Here, she describes the five ways she makes that a routine occurrence! |
| Best of Money | 8 Effective Ways to Raise Frugal Kids | Man vs Debt | Carmen Bolanos shares her secrets for instilling a frugal lifestyle in her kids - items #1 and #2 may shock you in the modern world…. |
| Best of Money | Learning Financial Lessons From Aesop's Fables | The Amateur Financier | The Amateur Financier finds there's a lot to be learned about finance from the classic animal stories passed down from ancient Greece. |
OMM's Running Index for 2010
Presented in reverse chronological order....
- On the Moneyed Midways - March 19, 2010
- On the Moneyed Midways - March 12, 2010
- On the Moneyed Midways - March 5, 2010
- On the Moneyed Midways - February 26, 2010
- On the Moneyed Midways - February 19, 2010
- On the Moneyed Midways - February 13, 2010
- On the Moneyed Midways - February 5, 2010
- On the Moneyed Midways - January 29, 2010
- On the Moneyed Midways - January 23, 2010
- On the Moneyed Midways - January 15, 2010
Older Editions
- OMM: The Best Posts of 2009 and our full index for the year!
- OMM's Running Index for 2008
- OMM's Running Index for 2007
- The Best Blogs Found in 2006 (and our full 2006 index)!
Labels: carnival
 In 2008, Arizona became the first state in the U.S. to implement photo speed enforcement, where high speed cameras are used to photograph both the driver and license plates of vehicles exceeding posted speed limits on the state's roads.
The way the system works, the photos of speeding vehicles are examined by the contractor who operates the photo radar system to determine if the images are clear enough for an identification of both driver and vehicle to be made. If so, a notice of violation is mailed to the vehicle's registered owner, requesting that they waive their rights to contest the violation and pay a fine of $181.50.
That number is important, because that $181.50 becomes the prize in an unusual kind of lottery for drivers who decline to waive their rights.
 The "lottery" works because if a month passes after the notice is mailed to the vehicle owner, who then declines to waive their rights and pay the $181.50 fine, the state's law requires that they be officially served notice of the violation in person. If they are not notified within 120 days of the issuance of the original notice, the speeding ticket, and the liability for paying the fine associated with it, goes away. Entirely.
If however they are served notice, then in addition to the fine of $181.50, they are also responsible for paying administration fees of $25.00 on top of it.
That $25.00 then is the cost of choosing to play what we'll call the Arizona State Photo Radar Lottery.
Here's what makes the lottery possible. There are so many potential photo speed enforcement violations being processed in the state at any given time that a good portion of those who have been mailed a notice of violation are never served notice in person within the period of time the state's law requires.
The Phoenix New Times reports that the odds of not being served notice in person are about 1 in 4.
Are those odds good enough to justify disregarding the original notice of violation for Arizona's speeders? After all, once a vehicle owner is served a notice of violation in person, they've lost the lottery, so to speak. They must pay the fine.
To find out, we've modified our tool for determining when it might make sense to buy a regular lottery ticket, and entered the relevant numbers into it. As with all our tools, you're welcome to change the values to run whatever scenario you wish. For the Arizona State Photo Enforcement Lottery however, we'll have more comments below the tool....
Using the default data for Arizona, we see that with a 1 in 4 chance of not being served in person should the registered vehicle owner choose to ignore the original notice of speeding violation, it makes more sense for them to risk the $25.00 additional fee to gain the chance of not having to pay $181.50. We find that with the same odds, the fine would have to be less than $100 for it to be more worthwhile to simply pay the fine.
We infer from this finding that the state of Arizona got greedy when setting the amount of the fine for photo speed enforcement.
It then comes as almost no surprise to find that Arizona drivers have largely chosen to ignore mailed notices of violation for speeding. As of June 2009, just 24% of drivers in the state who had been mailed such notices had paid them, down from the figure of 38% from when the system first went into operation in October 2008.
From a public policy perspective, if Arizona chooses to continue operating its system of photo enforcement, we find that it either needs to lower the fine for speeding below $100 or lower the odds of "winning" by increasing the number of people served in person.
Alternatively, the state could increase the amount of fees it charges to serve potential violators in person. We note however that this latter change would carry with it the unintended consequence of effectively increasing the amount of the "prize" to be won by ignoring the mailed notices of violation.
Unless and until such changes are made, we should expect that Arizona drivers will continue to choose to play the state's unofficial lottery.
Because deep down, you know you've always wanted to see it:

Previously on Political Calculations
Labels: none really
February 2010 saw some improvements in employment with surprising demographic beneficiaries for the month: young adults and teens!
 Compared to January 2010, some 308,000 more individuals were counted as being employed in the Current Population Survey. Of these, 104,000 (33.8%) were young adults between the ages of 20 and 24 and 64,000 (20.8%) were teens between the ages of 16 and 19.
These figures are especially significant given that the percentage share of young adults within the whole U.S. civilian labor force is just 9.0%, while teens account for just 3.2% of all U.S. workers. Both percentage shares represent a slight increase over the all-time lows recorded in January 2010.
The timing of the improvement for teens and young adults corresponds well with anecdotal data indicating that firms go through a 3-to-6 month adjustment period following a minimum wage increase regarding the primary effects of minimum wage increases upon employment levels. Since teens and young adults represent approximately half of all those who earn the minimum wage, the bottoming out of each age group's percentage representation within the entire U.S. workforce in the six months after the final of the recent series of minimum wage increases was to be expected.
With no additional increases in the federal minimum wage scheduled to take place in the near future, we would now anticipate that teens and young adults will now disproportionately benefit by taking a disproportionately larger share of newly filled jobs as compared to older workers.
Labels: demographics, forecasting, jobs, minimum wage
Welcome to the Friday, March 12, 2010 edition of On the Moneyed Midways, your single stop for catching up with the best of the past week's blog carnivals dedicated to the topics of money, personal finance, and business!
This is a big week in that the biweekly Cavalcade of Risk is celebrating its 100th edition. To join in the celebration, we're featuring the two best posts we found in the Cavalcade in this week's edition of OMM.
But that's not because of the occasion - seeing as we're also featuring two posts from this week's Carnival of Personal Finance. Instead, it's because this week's edition of the Cavalcade of Risk features two of the best posts we've seen contributed to this week's money and business-related blog carnivals. It also doesn't hurt that one of two just happens to be The Best Post of the Week, Anywhere!
That post, and the rest of the best posts of the week that was, are ready to help you kick off your essential weekend reading! It all starts below....
| On the Moneyed Midways for March 12, 2010 | |||
|---|---|---|---|
| Carnival | Post | Blog | Comments |
| Carnival of Debt Reduction | 5 Tips for Dealing with Medical Debt | Think Your Way to Wealth | RC leads with two statistics, one we knew (over 60% of all bankruptcies are attributable to medical debt) and one we didn't (of those, 75% were for people who *have* health insurance), before identifying ways to keep those debts lower. |
| Carnival of Personal Finance | What Happens When a Life Insurance Policy Lapses | Good Financial Cents | Jeff Rose tells what happened when his life insurance policy lapsed after he lost track of the deadline for paying the once-a-year annual premium. Absolutely essential reading! |
| Carnival of Personal Finance | Best Places to Hide Money at Home | Bargaineering | Want to know where the best places to stash cash in your home are for when the zombie apocalypse arrives? Jim Wang offers some advice…. |
| Carnival of Real Estate | Searching for Real Estate Made Easy: Geo-Fences Plus Mobile Phones | Software Advice | How will today's internet and cellular technology combine to affect how people will find their next home in the future? Chris Thorman peers through his crystal ball and finds a compelling vision for how it will work. |
| Cavalcade of Risk | Lies, Damn Lies, and Health Insurance | Insureblog | Does lack of health insurance increase an individual's risk of dying prematurely? Hank Stern finds pseudoscience lies behind such claims. |
| Cavalcade of Risk | Six Reasons to Think Twice About Hospital Payment Bundling and theRole of Population-Based Care/Disease Management | Disease Management Care Blog | "Bundling" hospital payments to avoid costly patient re-admissions is one of the principal features of the health care legislation now before the U.S. Congress. Disease management expert Jaan Siderov identifies six unintended consequences stemming from the poor understanding by policy makers of how the medical world really works that would produce undesirable outcomes. The Best Post of the Week, Anywhere! |
| Festival of Frugality | Ten Simple Strategies for Easier Meal Planning | Family Balance Sheet | If you're following both a food diet and trying to control your food budget, Kristia's post walks through what you can do to make both work for you! |
| Money Hacks Carnival | Debtmerica Relief Scam: The Story That Nobody Tells You | Stumble Forward | Christopher Holdheide fills in the missing pieces on how debt negotiation companies work in Absolutely essential reading! |
| Best of Money | Unconventional Personal Finance Advice | Studenomics | MD takes a walk on the wilder side of personal finance advice. Some quick teasers: Cut your losses. Pay for stuff you hate doing. Travel even if you don't have lots of money saved. |
OMM's Running Index for 2010
Presented in reverse chronological order....
- On the Moneyed Midways - March 12, 2010
- On the Moneyed Midways - March 5, 2010
- On the Moneyed Midways - February 26, 2010
- On the Moneyed Midways - February 19, 2010
- On the Moneyed Midways - February 13, 2010
- On the Moneyed Midways - February 5, 2010
- On the Moneyed Midways - January 29, 2010
- On the Moneyed Midways - January 23, 2010
- On the Moneyed Midways - January 15, 2010
Older Editions
- OMM: The Best Posts of 2009 and our full index for the year!
- OMM's Running Index for 2008
- OMM's Running Index for 2007
- The Best Blogs Found in 2006 (and our full 2006 index)!
Labels: carnival
Welcome to the blogosphere's toolchest! Here, unlike other blogs dedicated to analyzing current events, we create easy-to-use, simple tools to do the math related to them so you can get in on the action too! If you would like to learn more about these tools, or if you would like to contribute ideas to develop for this blog, please e-mail us at:
ironman at politicalcalculations
Thanks in advance!
Closing values for previous trading day.
This site is primarily powered by:
CSS Validation

RSS Site Feed
JavaScript
The tools on this site are built using JavaScript. If you would like to learn more, one of the best free resources on the web is available at W3Schools.com.
Other Cool Resources
Blog Roll


