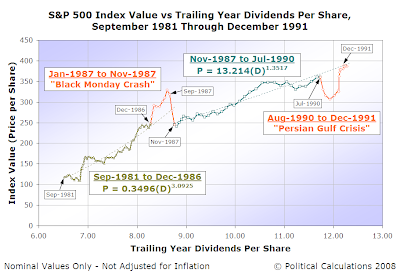
With the stock market having only recently been in free fall, we thought we'd take a closer look at the stock market crash of October 1987, putting it into the context of the market and events around it. In doing that, we'll be covering just over a decade from September 1981 through December 1991. The chart below surveys this full period, which includes two significant disruptive events: the Black Monday crash and the 1990-91 Persian Gulf War:

We'll begin taking a closer look by first examining the period of relative order in the U.S. stock market preceding the Black Monday crash, which approximately ran from September 1981 up to October 1987:

Using the statistical dating technique that we introduced previously in other analysis, we see that stock market crash of October 1987 really began as a positive disruptive event in January 1987. Here, we confirm that investors rapidly bid up stock prices over several months in reaction to accelerating corporate earnings. This is evident in the breaching of the upper limit three standard deviations above the projected central tendency, which confirms a the presence of a disruptive event during this period.
Futhermore, we can see earnings accelerating in the increased horizontal spacing between data points compared to the previous period. Since this data is reported quarterly, for investors to bid stock prices up in the months ahead of actual earnings announcements, they had to be anticipating higher earnings. After reaching a new level of equilibrium in March 1987, approximately centered on the upper 3-sigma limit established in the preceding period, the continued at this level through September 1987.
By mid-October 1987, as companies issued new forward-looking guidance, it became clear that the growth rate of corporate earnings was going to abate and be much reduced from the rate of previous months. Consequently, stock prices crashed, which confirms that this disruptive event was actually a bubble, although one of much smaller scale than that of the late 1990s.
In our next chart, we'll pick up with the remaining portion of the Black Monday stock market crash:

The period spanning from November 1987 thorugh December 1991 begins with the continuation of the crash that began on 19 October 1987. However, there was no erosion in stable component of corporate earnings, which we represent as trailing year dividends per share, so order in the stock market re-emerged quickly at a new, but lower, level.
That order continued all the way through July 1990. On 2 August 1990, the Persian Gulf nation of Iraq invaded neighboring Kuwait, which precipitated a negative disruptive event in the world's stock markets. The decline continued into October 1990 as world leaders formed a coalition to address the issue. Prices began rising in the months that followed and the stock markets recovered to their pre-invasion projected level of equilibrium following January 1991 when the U.S.-led coalition launched extension operations to expel Saddam Hussein's Iraqi forces from Kuwait and to restore Kuwaiti sovereignty.
Following this turmoil, a brief recession ensued which sent dividends into a minor retreat with no significant erosion of stock prices. A stable order re-emerged in the stock market beginning in January 1992.
A Random Black Swan Event?
We're not exactly sure why the Wikipedia article considers the Black Monday stock market crash of October 1987 to be some kind of mysterious black swan event. Perhaps the magnitude and immediate precipitating trigger for the sharp decline might be, but we don't believe there's really much mystery as to why it occurred. Investor expectations of the future value of the stable component of corporate earnings (dividends) did not materialize. Stock prices, which had been bid up in expectation of that future stream of income continuing to grow rapidly, fell sharply as a result. Just like one might reasonably expect that they would in that situation.
In that sense, it was nothing more than a demonstration of Milton Friedman's permanent income hypothesis, simultaneously and independently applied by a multitude of investors who came to the shared assessment that future earnings would be less than they had previously expected in a critical mass, and nothing less.
Previously on Political Calculations
Before today, we had only extended our unique brand of analysis back to December 1991. Here are the posts and direct links to all the charts we've presented to date:
- January 2008 through October 2008
- Chart: January 2008 through October 2008 - A new disruptive event!
- December 1991 through December 2007
- Chart: June 2003 through January 2008 - Order Re-emerges
- Chart: April 1997 through June 2003 - The Stock Market Bubble!
- Chart: December 1991 through April 1997 - Order in the 1990s
Labels: dividends, SP 500, stock market
Welcome to the blogosphere's toolchest! Here, unlike other blogs dedicated to analyzing current events, we create easy-to-use, simple tools to do the math related to them so you can get in on the action too! If you would like to learn more about these tools, or if you would like to contribute ideas to develop for this blog, please e-mail us at:
ironman at politicalcalculations
Thanks in advance!
Closing values for previous trading day.
This site is primarily powered by:
CSS Validation
RSS Site Feed
JavaScript
The tools on this site are built using JavaScript. If you would like to learn more, one of the best free resources on the web is available at W3Schools.com.