We've been tweaking our model of the distribution of household taxpayers in the U.S. and we've all but settled upon what we'll be presenting in this post and using in future discussions. First up, since we began building our distribution using the IRS' cumulative data for the number of tax returns filed by household Adjusted Gross Income (AGI), converted to 2006 U.S. dollars, we'll first present a chart showing our Zunzun-generated mathematical model along with our original data points:

Comparing the blue square points against the green curve, we can see right off that we have a fairly good match between our modeled data and the original data points. Believe it or not, the greatest errors between the actual data and our model occur at the low end of the income range. The magnitude of the error declines from 16.4% at an household AGI of $5,160 to 0.8% at an AGI of $20,639, with the average the errors for all values at or above this level coming in at 0.125%. The error visible at the household AGI of $206,398 is 1.7%, which is the greatest discrepancy between actual and modeled data for all values above $20,639.
As we'll discuss shortly, those larger errors at the lowest end of the income range of our model of U.S. taxpayer distribution won't present much of a problem in our little personal income tax project.
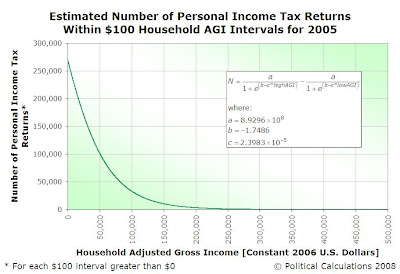
For our next chart, we used the mathematic model described above to determine the number of personal income tax filers for each $100 interval from $0 to $500,000. Actually, we did this for $100 intervals going well above $500,000, but we cut the chart off at this level because the number of returns filed declines very, very slowly from the already very low levels above it. This chart reveals where the bulk of U.S. personal income tax filers might be found according to their household Adjusted Gross Income:

The next two charts help reveal why the larger errors that exist between the actual data and our mathmatical model of the distributions of U.S. taxpayers in 2005 turn out to not be significant issue. In this next chart, we've multiplied the number of personal income tax returns within each $100 interval from $0 through $500,000 by the value of the midpoint of the indicated income interval. Doing so gives us a good approximation of the aggregate amount of household adjusted gross income that falls in that interval:

The peak in aggregate household Adjusted Gross Income of $5,084,754,013 occurs for the interval of $46,700 to $46,800. In other words, taxpaying households with an AGI between $46,700 and $46,800
The next chart applies the 2006 income tax rate schedule for Single taxfilers to this distribution of U.S. household taxpayer Adjusted Gross Income, which allows us to define the maximum potential income tax that could theoretically be collected for each $100 interval from $0 to $500,000, assuming no exemptions, deductions or other adjustments for income:

In this chart, we see that the combination of low incomes and low tax rates seriously reduce the amount of tax collections the federal government might obtain from low income earning households. And that's without reducing the amount of earned income that could be subject to personal income taxes by things like the standard deduction and personal exemptions or itemized deductions that reduce the amount of income subject to the personal income tax.
In fact, for 2006, with a standard deduction for Singles of $5,150 and a personal exemption of $3,300, at least $8,450 of adjusted gross income per income tax return would be fully exempt from personal income taxes. Add in married taxpayers filing jointly and/or dependents and/or itemized deductions and exemptions and the amount of adjusted gross income that's not subject to personal income taxes only gets bigger.
Big enough, in fact, that those large errors that we have between our model of the distribution of household taxpayer income and the actual figures at the low end of the income spectrum just kind of disappear (the beauty of multiplying by zero!) That means that our model of this very recent distribution of U.S. taxpaying households is something that we can use to, oh say, design a brand new, much simpler and effective tax code that provides the ability to find out how much you might pay as well as how much the federal government might collect.
Or maybe we ought to just make a tool that you can use to design your own tax code to find these things out for yourself!
We have a number of odds and ends to wrap up before we get there, but you can expect that tool in the very near future.
That tool is available now! Go build your own income tax!
Labels: income distribution, taxes
Welcome to the blogosphere's toolchest! Here, unlike other blogs dedicated to analyzing current events, we create easy-to-use, simple tools to do the math related to them so you can get in on the action too! If you would like to learn more about these tools, or if you would like to contribute ideas to develop for this blog, please e-mail us at:
ironman at politicalcalculations
Thanks in advance!
Closing values for previous trading day.
This site is primarily powered by:
CSS Validation
RSS Site Feed
JavaScript
The tools on this site are built using JavaScript. If you would like to learn more, one of the best free resources on the web is available at W3Schools.com.